
 Monthly Economic & Market Analysis August 2026 Global Economy Rising U.S. Tariffs and the impact on Exports Canadian and Chinese Merchandise Exports to the United States since Trump Election 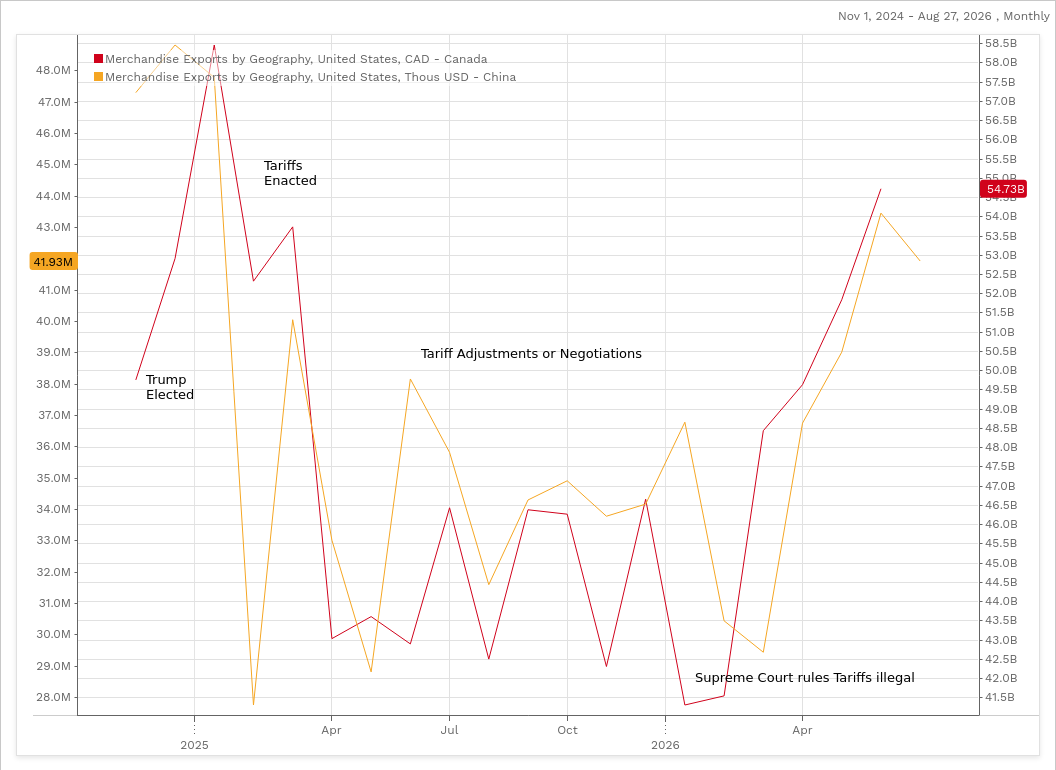 The U.S. Census Bureau lists Canada as the second largest importer of goods into the United States at $381.92 Billion and China as the third largest at $308.65 Billion (2025). Canada and China are also the second and third largest export markets for American goods, purchasing $333.62 Billion and $105.98 Billion, respectively. The chart above shows the change in the monthly volume of exports from Canada (red line) and China (orange line) into the United States. When Trump won the election in November 2024, many companies in Canada and China began increasing their exports into the U.S in fear of future tariff increases. Almost immediately after Trump was inaugurated in early 2025, he began raising tariffs rates on Canadian and Chinese goods causing their exports to the United States to fall dramatically. A period of fluctuating monthly exports ensued after political backlash, retaliatory measures, and trade negotiations led the Trump administration to adjust tariff rates. Ultimately February 2026, the tariffs enacted under the United States’ International Emergency Economic Powers Act (IEEPA) were deemed illegal by the United States Supreme Court, which revived the volume of exports from Canada and China. It should be noted that in 2025, one of China’s retaliatory measures was the restriction of rare earth elements into the United States. Rare earth elements are required in the production of artificial intelligence infrastructure, electric vehicles, and wind turbines, as well as many other important industrial components. The result of negotiations over China’s restriction of rare earth exports into the United States was not only a reduction in the tariff rate on all Chinese exports, but also a change in the tone from the American trade negotiators toward China. In 2016 before the first Trump administration begun its trade war with China, the United States was China’s top export destination representing 19.7% of its exports (World Bank). Since 2016, China has gradually diversified its exports away from the United States. Now in 2025, the Association of Southeast Asian Nations (ASEAN) is China’s largest export market at 17.6%, the European Union is its second largest at14.8%, and the United States is the third largest at 11.4% of total exports. Canada will need to leverage its strategic resources and find new opportunities to diversify its exports as the trade conflict with the United States heats up. United States The American economy slowed in the second quarter of this year, falling from a quarterly GDP growth rate of 2.1% down to1.5%. The United States lost -23.000 jobs in July, while the unemployment rate fell for a second consecutive month from 4.2% to 4.1%. Job losses were primarily in the retail trade, education, health services, professional services, business services, and manufacturing sectors of the economy. Job gains were mostly in the transportation, warehousing, government, and construction sectors. During the month of July, retail spending unexpectedly fell by -0.6%. American consumers cutback spending on online purchases, automobiles, and automobile parts. The U.S. inflation rate slid lower in July from 3.4% to 3.3%. The U.S. Federal Reserve will have to consider the elevated inflation rate when they convene for their next interest rate policy meeting on September 16. Economists remain divided regarding the Federal Reserve’s next rate decision. Canada Canada’s economic growth rate as measured by GDP grew 3.3% in the second quarter of this year, which is a dramatic improvement from the 0.3% growth rate attained in the first quarter. Improvement in growth of the Canadian economy was driven by a strong rebound in exports, residential construction, and business investment. Canada added a phenomenal 75,100 jobs in July, while the unemployment rate fell from 6.5% to 6.4%. Employment growth was led by jobs in wholesale and retail trade, finance, professional services, technical services, scientific services, and construction. Retail sales are estimated to have fallen by 0.6% in July. It is the first decline in Canadian consumer spending since December 2025. The decline was led by lower sales at gas stations. The Canadian inflation rate crept higher in July moving up from 2.8% to 3.0%, led by higher gasoline and food prices. The Bank of Canada is likely not pleased with July’s upward move in the inflation rate, but they are unlikely to increase interest rates in their next meeting on September 2nd. Eurozone The Eurozone’s 2026 second quarter economic (GDP) growth rate improved from the 0% to 1.8%. The number of employed people in the Eurozone grew by 0.1% to 176,577 million people in the second quarter of this year, which was equal to the 0.1% growth rate achieved in the first quarter. Eurozone employment growth was led by job gains in Spain and France but hindered by job losses in Germany. The Eurozone unemployment rate increased from 6.2% in May to 6.3% in June. Eurozone consumers spent less on food, drinks, and tobacco in June, which contributed to aggregate monthly retail sales falling by -0.3%. Increases in energy prices helped pushed the Eurozone inflation rate higher, from 2.8% to 2.9% in July. Economists are divided in their assessment on whether the higher inflation reading will be the impetus for the European Central Bank to raise interest rates in their September 10th meeting. China The Chinese economy grew at a slower pace in the second quarter of this year, falling from a quarterly GDP growth rate of 5.0% in the first quarter to 4.3% in the second quarter. China’s unemployment rate reversed a four-month downward trend, as it moved up from 5.0% to 5.2% in July. Chinese consumers managed to spend a little bit more in the month of July, as retail sales inched up by 0.06%. Another indicator of declining consumer demand in China was a fall in new bank loans by -340 Billion yuan in July after growing by 1,610 Billion yuan in June. The People’s Bank of China kept its 1-year loan prime rate at 3% in July. It has been unchanged for the last fifteen months. Markets Global Stock Markets Change in Global Stock Markets August 1 – 15, 2026 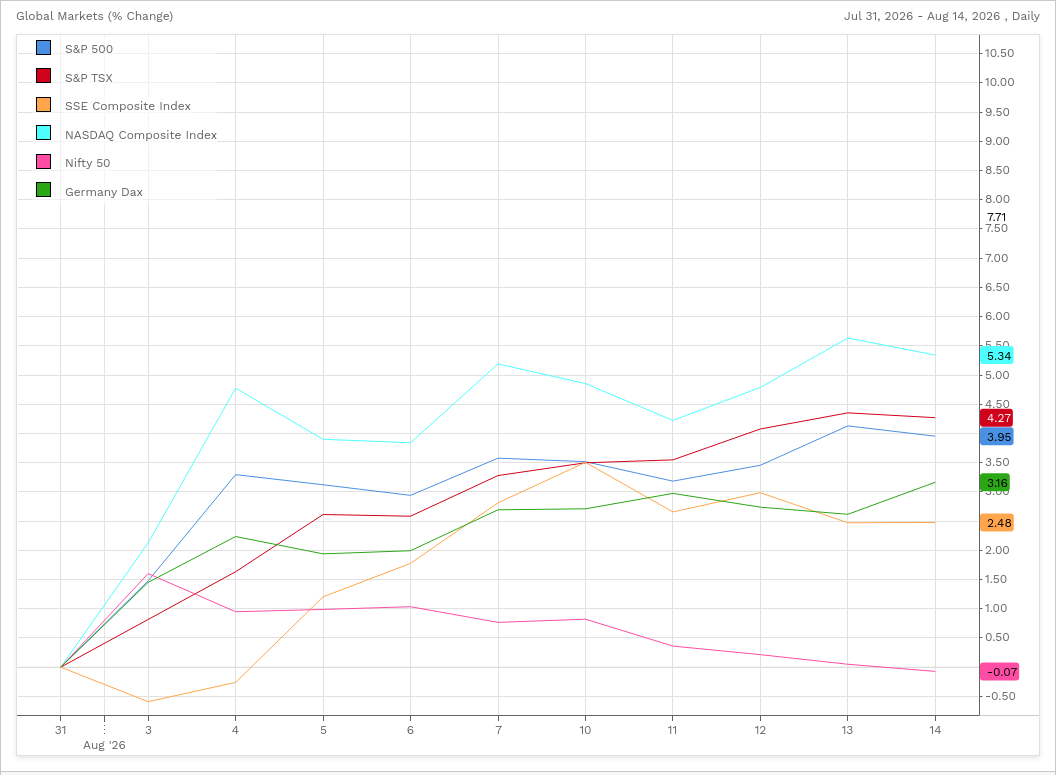 Source: FactSet® Source: FactSet® In the first two weeks of August the U.S. market (S&P 500) improved by 3.95%, while the Canadian market (S&P/TSX Composite Index) grew by 4.27%. The U.S. Nasdaq Composite index which contains a high weighting of technology related stocks increased by 5.34%. The German stock market (Dax 40 index) rose by 3.14%. The Chinese market (Shanghai Composite Index) grew by 2.48% and the Indian market (Nifty 50 Index) fell by -0.07%. Bond market investors were jittery in August. The bond market is concerned about possible interest rate increases by the U.S. Federal Reserve this Fall. Inflation and inflationary conditions are on the mind of many central bankers, including those in the Bank of Canada and the U.S. Federal Reserve. Despite rising bond yields, stock market investors are still enthusiastic about the growth of artificial intelligence and the ecosystem required to sustain it. High-end AI chip producer Nvidia had another blockbuster quarter with revenue more than doubling in the last twelve months. The question, stock market investors are asking is: will AI infrastructure spending growth continue into the future? Given the rapid adoption rate of artificial intelligence among businesses and consumers, we should expect AI infrastructure needs to continue expanding for many more months to come. 1 (Source: Bank of Canada) 2(Source: Statistics Canada) 3(Source: United States Bureau of Labour Statistics) 4(Source: United States Bureau of Economic Analysis) 5(Source: United States Federal Reserve) 6(Source: United States Census Bureau) 7(Source: FactSet as of August 15th, 5:00 PM) *This information has been prepared by Desmond Rubie, BCom, FCSI®, CIM®, CFP® who is a Wealth Advisor for iA Private Wealth Inc. and does not necessarily reflect the opinion of iA Private Wealth. The information contained in this newsletter comes from sources we believe reliable, but we cannot guarantee its accuracy or reliability. The opinions expressed are based on an analysis and interpretation dating from the date of publication and are subject to change without notice. Furthermore, they do not constitute an offer or solicitation to buy or sell any of the securities mentioned. The information contained herein may not apply to all types of investors. The Wealth Advisor can open accounts only in the provinces in which they are registered. *IA Private Wealth Inc. is a member of the Canadian Investor Protection Fund and the Canadian Investment Regulatory Organization. iA Private Wealth is a trademark and business name under which iA Private Wealth Inc. operates. * Insurance products are provided through iA Private Wealth Insurance, which is a trade name of PPI Management Inc. Only products and services offered through iA Private Wealth Inc. are covered by the Canadian Investor Protection Fund. Desmond Rubie, BCom, FCSI®, CIM®, CFP® Wealth Advisor Rubie Wealth Management Group | iA Private Wealth Insurance Advisor | iA Private Wealth Insurance* 26 Wellington Street East, 2nd FloorToronto, ON M5E 1S2 Direct: 416-203-2228 Office: 416-203-2226 Desmond.Rubie@iaprivatewealth.ca rubiewealth.com |

Insight Categories
- Economy
- Estate Planning
- Financial Literacy
- Insurance
- Investment Management
- Markets
- Philanthropy
- Tax Planning
Insight Archive
- October 2026
- September 2026
- August 2026
- July 2026
- June 2026
- May 2026
- April 2026
- March 2026
- February 2026
- January 2026
- December 2025
- November 2025
- October 2025
- September 2025
- August 2025
- July 2025
- June 2025
- May 2025
- April 2025
- March 2025
- February 2025
- January 2025
- December 2024
- November 2024
- October 2024
- September 2024
- August 2024
- July 2024
- June 2024
Site Map
- About
- Business Succession
- Case Studies
- Cash Flow Management
- Charitable Giving
- Contact
- Education Planning
- Estate Planning
- Events
- History
- Insights
- Investment Management
- Log in
- News
- Our Team
- Philosophy
- Retirement Living
- Retirement Planning
- Risk Management
- Socially Responsible Investing
- Solutions
- UK Pension Transfers (QROPS)
- Video
- What We Do


Leave a Reply